Expression Profiling Provides Most Detailed Classifications of Pediatric and Adult Acute Lymphoblastic Leukemia
by Tommy Broudy
Dr. William Evans and Dr. Torsten Haferlach discuss the emerging role of microarray expression analysis in cancer classification and diagnosis Leukemia was one of the first cancers that researchers studied using microarray gene expression profiling. But recent advances in whole-genome analysis have enabled scientists to subtype the disease in totally new ways, including more detailed subclassifications, prognoses, and drug-sensitivity status. Dr. William Evans from St. Jude Children's Research Hospital in Memphis, Tennesse has studied pediatric acute lymphoblastic leukemia (ALL) for over 30 years, and his group was among the first to use high-density microarrays for ALL profiling. “The expression patterns we've found are largely concordant with known ALL subtypes, but within any of those subtypes of ALL, even those with the best prognosis, we always had patients with a bad outcome,” said Evans. “Our recent focus has been on trying to learn something new about why some kids respond and some don't to the same treatment.” Dr. Torsten Haferlach's research team at the Ludwig Maximilians University in Munich has taken a similar approach studying adult ALL. His group has developed expression signatures across a broad range of leukemias and leukemia-related disorders, including ALL, acute myeloid leukemia (AML) and acute promyelocytic leukemia. Evans and Haferlach recently sat down with AMB Managing Editor Tommy Broudy to discuss the key challenges they face implementing microarray expression analysis in their leukemia research. Topics covered include: - Developing methodologies to assess tumor load and purity
- Adequately powering studies for class discrimination
- Integrating different types of molecular data
- The role of technology in study validation
Tumor load and purity
Broudy: Tissue heterogeneity can greatly influence cancer classification. Traditionally, people have accounted for this through pathological and histological methods. What are your thoughts about putting heterogeneity classifier probes on the microarray itself to do this? Evans: We're always struggling with this in terms of how much noise is being introduced by cells that aren't really what we are interested in. And the idea of putting some classifier probes on the array is a good one. You would, of course, perhaps want some signatures that might tell you what other kinds of cells you might have contaminating the sample. But, one reason that we work with leukemia is because it's easier to deal with that problem—we can just do purification and enrichment of bone marrow samples. In a lot of our work we have had minimum thresholds for percent of leukemia cells in a bone marrow before we'll include it in the analysis. In some of our earliest papers looking at classifications, we had data that said if we go from saying 70 percent cut-off of leukemia cells to 90 percent, then the data looks even cleaner, as you would expect.  Haferlach: Well, we have had the same experience and the question always is, 'What is a tumor cell?'
While we are happy having blood and bone marrow samples—even if their blast count is below 70 or 80 percent—we know from our interphase fluorescence in-situ hybridization (FISH) analysis that many other cells also belong to the tumor population. So in our experience it does not matter if the tumor load is 90 percent or 100 percent, especially if what we are addressing is the diagnostic approach. The pattern of genes that can be recognized for a specific diagnostic pattern is so stable that you can do it with even lower numbers of tumor cells. That does not mean that they are looking like blasts, so in our opinion it is much easier, and this is what is seen in the literature, that leukemia can be taken as an example in the paradigm for using tumors for diagnostics. For example, using microarrays, the tumor purity in our hands is normally above 70 to 75 percent, and that works as far as we use it. We don't purify in any case, we just do a Ficoll separation and then perform the microarray analysis. Evans: We generally don't purify them either if they're in that range. Broudy: What are the typical tumor cells counts when a patient is in blast crisis? Evans: Well, we're dealing with acute leukemias, and these patients typically present with very high circulating leukemia cell burdens. It's often 10,000 or so circulating blast count; but it can be 100,000 or more. And when we look at marrows at diagnosis, typically it's 70 to 90 percent or more leukemia cells in the bone marrow. That's at initial diagnosis. Now, in a patient who has relapsed, it's a bit different, it may only be 25 percent leukemia cells in a marrow. That's one of the challenges we've seen with doing expression profiling of relapse samples—you have fewer cells in the marrow and it's a smaller percentage. Haferlach: That's why our group is looking for diagnostic profiles. We only use samples from the primary diagnosis and mostly stick to bone marrow, not to peripheral blood. But it works the same. For example, if you look for chronic myeloid leukemia, you will see blast counts below 10 percent. However, if you use the same smears and apply interphase FISH, then you will see that the number of malignant cells are 85 or 95 percent. So it's different looking at this smear in the microscope and doing a specific analysis like FISH on the samples. But normally we've found the same thing as Dr. Evans—the number of tumor cells is, at least at the diagnosis of the primary disease, more than 70 or 75 percent in leukemia. Power and Class Discrimination
Broudy: There seems to be an explosion of cancer subclassifications. What types of assumptions do you need to make when you're starting a study to achieve enough power to discriminate the smallest class? Haferlach: That's a very difficult question because it depends on what you want to do. If you want to make a diagnosis, I think you need at least 10 to 15 or 20 samples from the same biological kind. Then you can start making an analysis using the biostatistic approaches and then find some genes. But, if, for example, you want to approach a group of AML with a normal karyotype that show several molecular mutations, you will need 100 or 200 or 300 or more samples to come up with a new classification. And so, it really depends on what you are looking for and where you go to. Then you can define the data set and the number of samples. Evans: And sometimes you have unexpected subclusters that you didn't anticipate and it could be by chance or due to small numbers, or it could be of biological importance. In situations of uncertainty, you must go back and find additional cases that would allow you to develop a more robust signature and then test it in an independent cohort to see if it really is a unique subgroup of leukemia and let that take you to the biology of that subset. So there's an aspect to this that's unbiased in terms of the possibility of making some findings that you wouldn't have anticipated a priori, and that may need to be a preliminary finding the first time through, that you then go back and replicate or expand with adequate numbers. It may turn out to be noise, but you have to sort that out in the next experiments. Haferlach: This is absolutely true. If you come up with some genes that do something or suggest to do something, then you need to study a cohort of patients that have never been in the analysis. Many, many experiments are hampered because the number of patients is too low and what was seen there was not tested in an unrelated cohort, and this makes it really weak from my perspective. 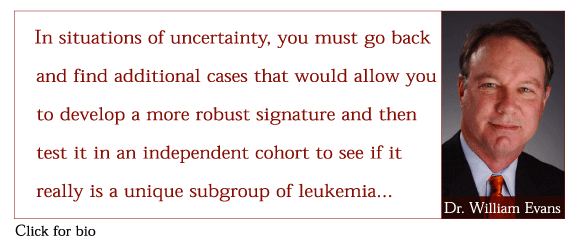
Broudy: Discriminating between the many different subtypes of ALL is not just a binary A or B type decision. What statistical methodologies, such as Support Vector Machines (SVM) or One-Verses-All (OVA) perhaps, are you using to take this complex set of conditions into account? Evans: In some situations, you have multiple classes of phenotypes, and in other situations the phenotype can be a continuous variable (e.g. drug sensitivity). So, in the latter case, instead of using SVM, we have taken a linear-weighted average approach to initially look at linear correlations between gene expression and a phenotype. We published some of those data in the Lugthart et al. paper in the April 2005 issue of Cancer Cell. In this case, we had an LC50 value, a sensitivity to drug value for 400 different patients. And there was a correlation struc-ture that we thought we should take advantage of, in terms of identifying what the principal components were that we should be fitting to the model. And so we ended up identifying genes, and then essentially weighting each one of those 50 significant genes somewhat differently to create the best model for discriminating sensitivity to drugs among different leukemias. So that's quite a different approach than we had taken previously when we were asking other questions in a similar context. And it was because we had the informaticists, who are at every lab meeting and every research workshop and every discussion about how these experiments are going to be done and how to best analyze them. I think you're just going to continue to see additional approaches; one vs. all is another option that you alluded to. In terms of a classifier, SVM's still our work horse. Integrating expression, genotype and proteomic data
Broudy: Are you integrating multiple molecular sets, such as genotype data, pro-teomic data, or expression data to present a singular decision at the point of treatment? Evans: There's power in all of those approaches, and sometimes they overlap. We're often using germ-line polymorphisms to identify the appropriate dose of a given drug or to select a drug for individual patients, and that's information that may or may not be imbedded in a gene-expression profile. Obviously, it's typically a germ-line polymorphism, and so in some settings we find that helpful in making treatment decisions. Some of our work now is looking at germ-line polymorphisms in the promoter regions of genes that we see expressed at different levels in leukemias that are sensitive vs. resistant to a given drug. The question there becomes: 'Is there a polymorphism that is determining whether a child's leukemia cell is over- or under-expressing a given gene that is significant in our analysis?' Of course, in the simplest world, it would be. But it may be that there is a polymorphism in a transcription factor, not a transcription factor binding site, that is driving the level of expression. A lot of what's of interest now is the pathway, and not just a single gene or pattern recognition. We've gotten lucky recently—this is not published—but on a couple of genes we do find single nucleotide polymorphisms (SNPs) in promoter regions that are predictive of expression levels in leukemia cells. But that won't be the case for all these genes. Haferlach: We're just starting with these DNA arrays and p53, especially in AML with complex aberrant karyotypes, because we know that many of these patients have a p53 deletion and we are looking for mutations. If there are no deletions there, then we ask, 'Is there at least some mutation in the gene?' All these techniques are not in competition, but are used in combination. If we want to know more, not only about diagnosis, but also about drug response, biological backgrounds and pathways, we shouldn't just spend our time on one technique, but rather combine all these different approaches in one data set. We're doing this in our lab as well as combining all this with morphology, molecular genetic data and immunophenotyping. This is very, very interesting and we will come up with many more answers this way than relying on just one technique. Technologies for validating results
Broudy: How do you see a technology like multiplex polymerase chain reaction (PCR) working with microarrays? Are you using them together now? Haferlach: We are just using it for testing the genes that come up as most discrimi-native between several leukemia sub-classes just to see them on another platform. We use the ABI cards to do this and we found a very high correlation with these specific genes—we did it just to see if they work on the other platform as well. I'm quite sure that if you have 364 genes on this plate, you can also use it for several approaches, because normally you do not need 40,000 genes. But on the other hand, a platform like Affymetrix' in our hands is much more robust than the ABI platform using these gene cards. In the next three to five years, we will see which platform comes out on top, but from my experience right now, I think the gene expression profiling using the Affymetrix technology is ahead. Although you don't need all the genes that are on the array now for diagnostic questions and answers. Evans: Yeah, I don't have much of a different point of view on that—we'll have to see. If we can do 30,000 probe sets for the same price as the 300-probe-set approach by multiplex PCR, then people are going to do 30,000. Haferlach: It's absolutely true what Dr. Evans said—100 percent. We're happy to have the opportunity to have three or five different probe sets for the same gene on an array, rather than just having one on the ABI cards. FOR MORE INFORMATION | Contact Information
![]() William Evans, PharmD
St. Jude Children's Research Hospital 332 North Lauderdale Street Memphis, Tennessee 38105
Evans laboratory website ![]() Torsten Haferlach, MD
Labor für Leukämie-Diagnostik Medizinische Klinik III
Ludwig-Maximilians-Universität
Grosshadern
Marchioninistr. 15
81377 München
Germany
Companies
![]() Affymetrix Inc.
![]() Applied Biosystems Inc. Organizations:
![]() St Jude Children's Research Hospital
![]() Labor fur Leukämie-Diagnostik | Background
![]() UCLA Collaborative Oral Fluid Diagnostics Research Center
![]() UCLA Human Salivary Proteome Project Further Reading
![]() Lugthart S, Cheok MH, den Boer ML, Yang W, Holleman A, Cheng C, Pui CH, Relling MV, Janka-Schaub GE, Pieters R, Evans WE. Identification of genes associated with chemotherapy crossresistance and treatment response in childhood acute lymphoblastic leukemia. Cancer Cell 2005; 7:375-86.
![]() Holleman A, Cheok MH, den Boer ML, Yang W, Veerman AJ, Kazemier KM, Pei D, Cheng C, Pui CH, Relling MV, Janka-Schaub GE, Pieters R, Evans WE. Gene-expression patterns in drug-resistant acute lymphoblas-tic leukemia cells and response to treatment. N Engl J Med 2004; 351:533-42. | ![]() Haferlach T, Kohlmann A, Schnittger S, Dugas M, Hiddemann W, Kern W, Schoch C. A global approach to the diagnosis of leukemia using gene expression profiling. Blood 2005; May 5; [Epub ahead of print].
![]() Sridhar Ramaswamy, Pablo Tamayo, Ryan Rifkin, Sayan Makherjee, Chen-Hsiang Yeang, Michael Angelo, Christine Ladd, Michael Reich, Eva Latulippe, Jill P. Mesirov, Tomaso Poggio, William Gerald, Massimo Lodo, Eric S. Lander, and Todd R. Golub. Multiclass cancer diagnosis using tumor gene expression signatures. PNAS 2001; 98(26):15149-15154.
|
|



